Quote:
Originally Posted by fielderLS3

I think I get it. So it doesn't matter what the gearing does as long as the torque and revs are calculated at the same point within the system, right?
Yes
So given the HP and torque ratings given, 130hp/400tq, if that is after all the gear reduction, that means the 400 torque is basically the torque at the wheels (assuming an idealized 100% transfer to make it simple to think about), and that the 130 horsepower is calculated using that figure for torque, with the RPM term being how fast the wheels/tires of the car are turning? Do I have that right?
Looks like it
A couple more questions about this...is there some kind of industry standard yet as to whether the torque rating includes or doesn't include the gear reduction? From what I understand from your explanation, it won't affect the horsepower rating, but usually when looking for a daily driver, I'm more interested in torque than horsepower (which, incidentally, is why I like diesels).
Not to my knowledge, but that doesn't mean there isn't one out there I haven't heard of
Also, we've all seen horsepower/torque graphs for gas engines, but have you ever seen one for an electric car? What does that look like? Most of them I have read about are rated for peak torque at 0 RPM, but how fast is the drop-off as speed increases? And is the RPM on such a graph the speed of the motor, or the speed after gear reduction?
|
It varies. Different electric motor types have different characteristics and the shape of the curve can be manipulated by the maximum current allowed by the controller. In its most basic form, the torque 'curve' for an electric motor is a straight line with a maximum at 0 rpm and constantly declining until it reaches 0 at maximum revs. Others look sorta like a rectangle with a 1/4 circle taken out of them in the upper right corner. They'll maintain maximum torque for a while then drop off sharply but as rpms continue to increase, the drop off rate slows down. Ummm ... it looks like this:
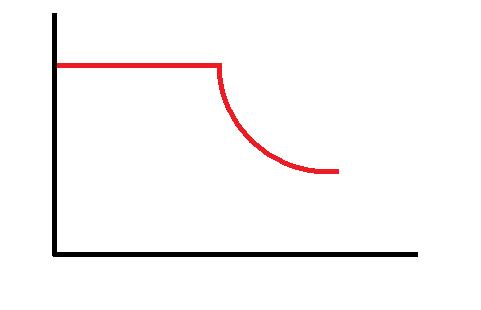
The speed and torque on the graph would most likely be after the gear reduction, but I can't say for certain and if there isn't any sort of standard for advertising these numbers, it could easily switch from one manufacturer to the next.
*EDIT*
There are other generic torque curves that electric motors have, but I can't recall them off the top of my head and I don't feel like rooting around for my old electro-mechanical energy conversions text book tonight.